

Many organizations produce massive amounts of data at every click every day. For each product and service that businesses provide, making decisions according to market trends is critical to satisfy the customer. Sometimes, decisions must also be made quickly, but the inability to comprehend and analyze information prevents them from making the right choice.
Here, real-time data visualization enters the picture as a game-changer utilized by every data-working developer and engineer. There is no doubt that people can clearly understand graphics, charts, and other visual aids better than long documents loaded with text, figures, and data. Data visualization in real-time is distinguished by its ability to make decisions quickly.
This article aims to help you make quick decisions by explaining the advantages of data visualization in real-time and providing examples of its applications and related tools.
Table of Contents
What Real-Time Data Visualization Is All About?
A senior executive will not alter their organization’s strategy based on a single chart. But what about individuals who need to make decisions fast? They rely on real-time data visualization for assistance, which is a process that falls under the domain of data visualization.
This technical approach presents the data in real-time through various visualizations, enabling users to access and evaluate information as soon as it is generated and processed. It functions similarly to a real-time feed of your data, displaying events as they happen.
This real-time visualization lets you to immediately identify patterns, spikes, and irregularities by transforming streams of incoming data into images. This instant glimpse keeps you informed and flexible by assisting with prompt decision-making.
Know The Benefits of Real-Time Data Visualization
Why should you consider creating a data visualization in real time? It’s a best practice that offers many benefits. Here are a few of the main advantages:
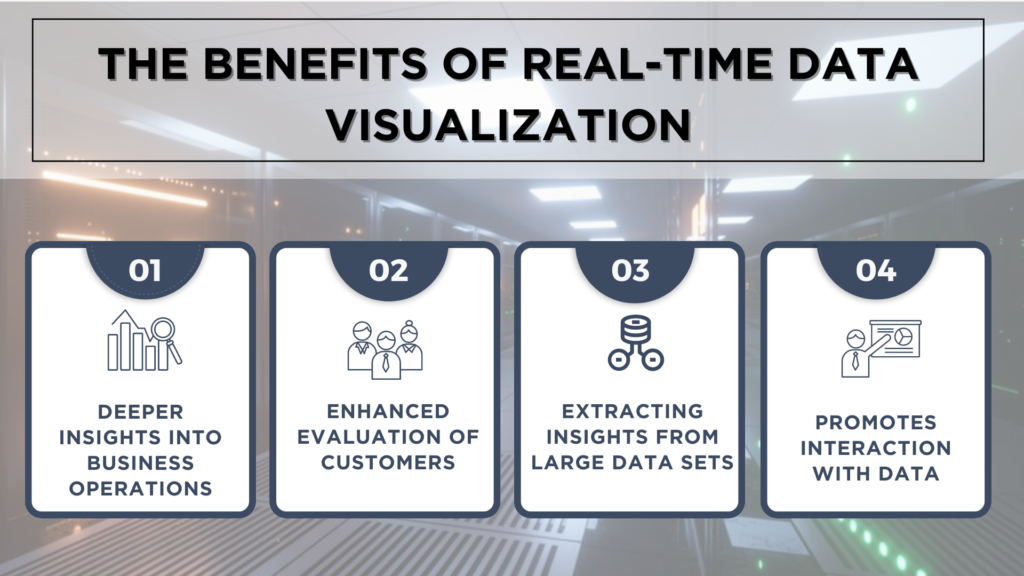
1. A Better Awareness of How Businesses Operate
Decision-makers can rapidly monitor interrelated business processes using this real-time data visualization tool, which provides a clear snapshot of operations. With instant access to real-time data, patterns and insights can be found, allowing for prompt performance optimization adjustments. Businesses can quickly adapt and enhance results by identifying their strengths and areas for improvement.
2. Enhanced Evaluation of Customers
Businesses can track changing customer behavior patterns with real-time visualization, which provides quick insights into preferences and pain points. Due to this timely knowledge, businesses can swiftly modify their plans to match consumer wants by strengthening customer relationships and increasing satisfaction. As a result, businesses are more equipped to make choices that meet the expectations of their target market.
3. Extracting Insights from Large Data Sets
Real-time visualization makes complex information more accessible to understand by facilitating the quick identification of patterns and correlations within large data sets. This instantaneous insight can identify significant trends and help firms respond more effectively to shifts in performance and customer behavior. Many businesses want perfect data insights from extensive data into the visual format; for that purpose, one solution they look out for is to have data visualization services, which serve as a smooth transition of their real-time data into captivating visuals. It will provide an easy way to make profitable judgments based on interactive graphs and charts quickly.
4. Promotes Interaction with Data
Employees can examine dynamic datasets with real-time data visualization, leading to more insightful conversations. This interaction fosters collaboration, sparking innovative solutions as teams understand real-time trends and patterns. The ability to immediately act on fresh data leads to more agile decision-making, driving impactful business outcomes.
Explore The Use Cases of Data Visualization in Real Time
1. Monitoring of Medical Data
Real-time data visualization in healthcare enables medical personnel to monitor vital indications like heart rate and oxygen saturation rapidly. This gives immediate access to vital information and quickly identifies patient conditions, ensuring prompt treatments. This ability not only enhances patient outcomes but also encourages proactive healthcare management.
2. Management of Production Lines
Real-time production line monitoring allows for the quick identification and handling of abnormalities, such as equipment failures or variations in output quality. This method reduces expensive downtime while preserving optimal production rates. By displaying real-time data, manufacturers can maintain high operating standards and promptly address problems.
3. Managing Crises
Since real-time visualization of data offers quick insights into lingering problems, it has also been essential for crisis management. In times of crisis, like cyberattacks or supply chain disruptions, visual tools help pinpoint the problem areas swiftly, assess the impact, and execute rapid responses. This approach reduces the effect of disruptions and facilitates prompt, well-informed decision-making.
4. Administrating Supply Chain
Data Visualization in real-time has transformed supply chain management. It provides managers with instantaneous progress and delay monitoring through real-time updates on shipment status. This capability helps streamline operations by optimizing routes and minimizing disruptions. With these insights, businesses can reduce costs, enhance resource allocation, and improve overall supply chain responsiveness.
Supportive Tools For Better Data Visualization In Real Time
Real-time analysis can be done with a range of data visualization tools. Each approach has a unique strength. Below, you can get an idea of various tools:
1. Power BI
Power BI is a cloud-based analytics solution that allows users to connect to multiple data sources and create interactive, shareable dashboards in real-time. Its intuitive design supports various power BI services, like advanced analytics and dashboard development, so teams can swiftly make data-driven choices. This helps make trends and insight simple to visualize.
2. Kibana
This potent tool provides real-time data visualization through configurable alerts and dynamic dashboards. With Kibana, users can effortlessly track and analyze live data streams, ensuring immediate insights and actionable intelligence.
3. Apache Kafka
Apache Kafka offers a strong foundation for developing adaptable data visualization solutions because of its capacity to manage massive real-time data streams. Its low-latency data processing guarantees rapid insights, which is essential for flexible decision-making.
4. The Grafana
This robust open-source platform allows users to design customized and adaptable dashboards for different data sources. It excels at real-time monitoring and visualization. Its alerting features ensure that groups can react quickly to important changes, improving operational insights and decision-making.
5. Tableau
This advanced data visualization tool supports the user by letting them connect to multiple data sources and build dynamic, interactive dashboards thanks to its user-friendly interface. Its real-time analytics capabilities empower businesses to make informed decisions quickly, transforming data into actionable insights.
Conclusion
Organizations can maintain their agility and responsiveness in a fast-paced environment by utilizing the potential of real-time data visualization. This method makes data-driven decisions that improve overall performance possible by giving quick insights into operations, consumer behavior, and market trends.
The diverse use cases of real-time visualization in various sectors, from crisis management to managing healthcare operations, demonstrate its vital role in enhancing performance and effectiveness. As technology evolves, the future of data visualization in real-time promises even greater integration of advanced analytics tools and real-time data streams by influencing its impact on strategic decision-making.